



















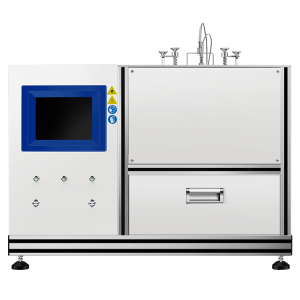






Lithium-Ion Battery ARC Testing: T1, T2, T3 and Heat Release
In ARC thermal runaway testing, T1 is the self-heating onset temperature, T2 is the thermal runaway trigger temperature and T3 is the maximum temperature. These markers are not the T1–T5 test procedures in UN 38.3 transport testing. An accelerating rate calorimeter (ARC) follows a lithium-ion cell’s self-heating under near-adiabatic conditions, and heat release is derived from the adiabatic temperature rise with an appropriate effective heat capacity. All markers and the energy result depend on the sensor arrangement, test protocol and data-reduction assumptions.
An ARC reduces heat loss from the chamber while the cell heats itself, so the measured temperature rise is closer to the cell’s own thermal behavior than a conventional oven test. The trace supports cell-to-cell comparisons of intrinsic safety, rather than a qualitative “smoke, fire, explosion” observation. In China, T/CSAE 344-2024 provides a method for adiabatic thermal runaway testing of lithium-ion traction battery cells.
How heat–wait–search (HWS) works
Heat. The chamber brings the cell to the next temperature step. Wait. The cell and chamber are allowed to approach equilibrium. Seek. The instrument checks whether the temperature rises above a defined self-heating-rate threshold. If the seek criterion is met, the chamber tracks the cell temperature to reduce heat exchange while the event develops.
The laboratory defines the initial temperature, step size, wait and seek times, detection sensitivity and termination criteria in the chosen protocol. The wait period matters for larger cells because the surface and center can equilibrate at different rates. Plot the chamber temperature alongside the cell channels to see where the chamber tracks the cell and where it lags.
What T1, T2 and T3 tell you
T1, T2 and T3 are not three equally weighted numbers. Each marks a different decision point on the same self-heating curve, and each should be reported with its detection criterion, channel and sensor position.
T1: the start of detectable self-heating. T1 is where the cell first produces heat faster than it loses it, at a level the chosen method can detect. It is method-dependent: common ARC thresholds range from 0.01 °C min⁻¹ to 0.02 °C min⁻¹, and the choice of threshold shifts the reported value. For engineering purposes, T1 defines the upper edge of the normal operating window; a cell whose T1 sits close to its maximum service temperature has little margin before self-heating begins.
T2: the trigger of rapid runaway. T2 is where the self-heating rate departs from slow, roughly linear behaviour and enters exponential acceleration. It is widely treated as the most safety-critical of the three parameters, because once T2 is crossed, the cell is no longer in a controllable regime. Mechanistically, T2 is associated with the convergence of cathode oxygen release, anode lithium plating and separator collapse—three failure modes that individually may be tolerable but together drive the rate into hundreds or thousands of degrees per second. For a system designer, T2 is the last temperature at which an intervention—cooling, current interruption, venting management—can still change the outcome. The method’s dT/dt threshold, duration and sampling interval should be reported with T2.
T3: the peak, and the consequence. T3 is the highest valid temperature recorded during the event, at the stated sensor location. It reflects the energy actually released within the measurement boundary, not the total chemical energy of the cell. T3 is influenced by heat loss, venting and sensor position, so it is best read as a consequence metric: it tells you how severe the event became under those specific conditions, not as an intrinsic material property. Report the sensor position, time of peak and any saturation or contact loss.
The decision-relevant quantity is not any single marker, but the interval between T1 and T2. That window is the time available for detection and response. Reported warning times for 18650-format cells under ARC range from a few hundred seconds to several thousand seconds depending on chemistry, SOC and detection threshold. A wide T1–T2 window means the system has room to react; a narrow window means T1 detection is practically useless because runaway follows too quickly. Reporting T1, T2 and T3 together—rather than T2 alone—is therefore what makes early warning actionable.
Document the cell and sensor arrangement
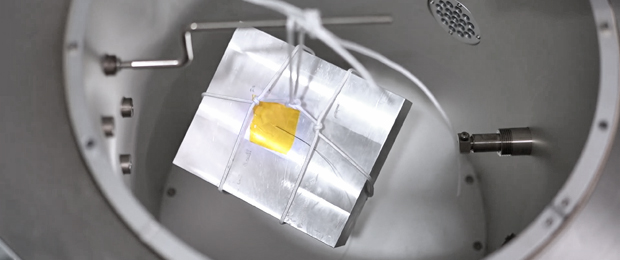
Because T1/T2/T3 depend on where the thermocouple sits, the cell and sensor arrangement must be documented before comparing results. Record the cell format, chemistry, rated capacity, mass, state of charge (SOC), state of health and conditioning history. Confirm instrument calibration and establish a common time base for temperature and voltage. Document the fixture’s contact points and thermal mass, and keep the intended vent path clear.
Secure the primary surface thermocouple at a defined location. For a prismatic or pouch cell, record its position on the broad face and how contact is maintained if the cell swells. Internal temperature measurements require an appropriately instrumented specimen and a validated preparation protocol. Report the sensor location and any specimen modifications with the result. A thermocouple that moves or loses contact can create an apparent temperature drop during the fastest part of the event.
What to include in the final ARC report
Include cell conditioning, fixture, calibration, HWS settings, sensor positions, time-series data and the criteria for all event markers. Present internal and surface values separately, mark the termination or cooling point, and name the heat-release method and energy boundary. Compare equivalent SOC, aging, trigger and fixture conditions when evaluating a design change. Use the cell-level results as inputs to a separate propagation assessment for the actual module or pack.
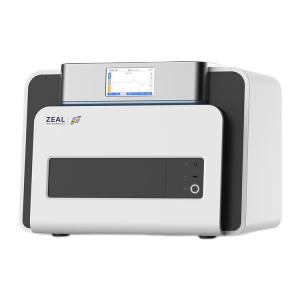
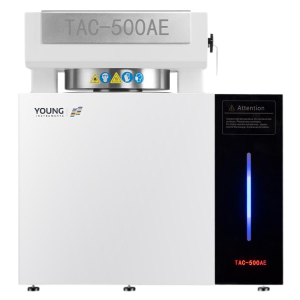
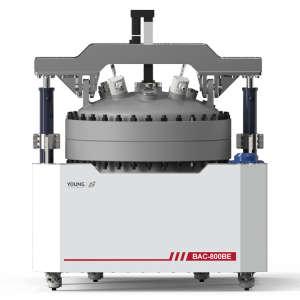
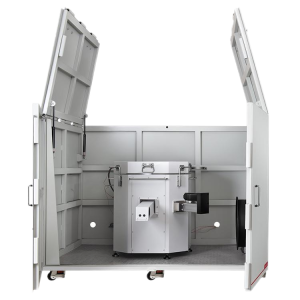
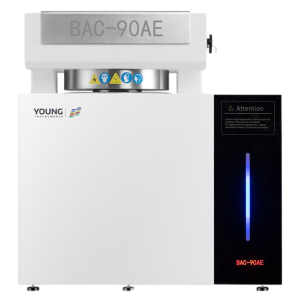
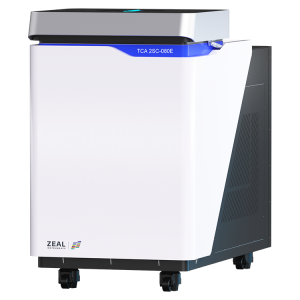
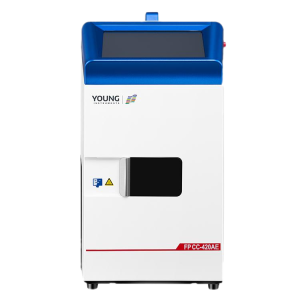
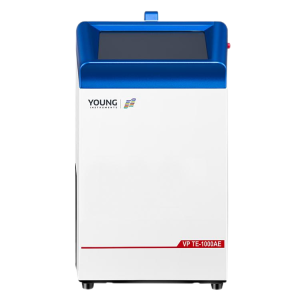
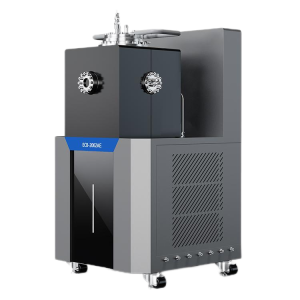
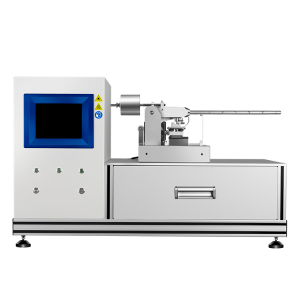
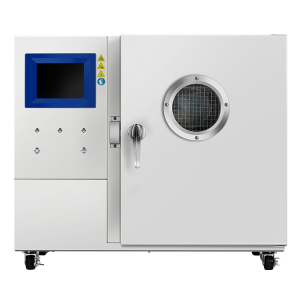
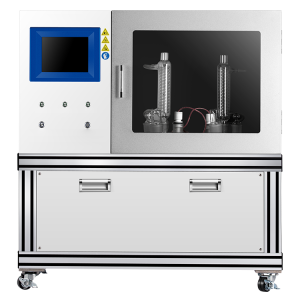
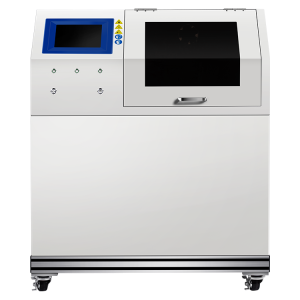
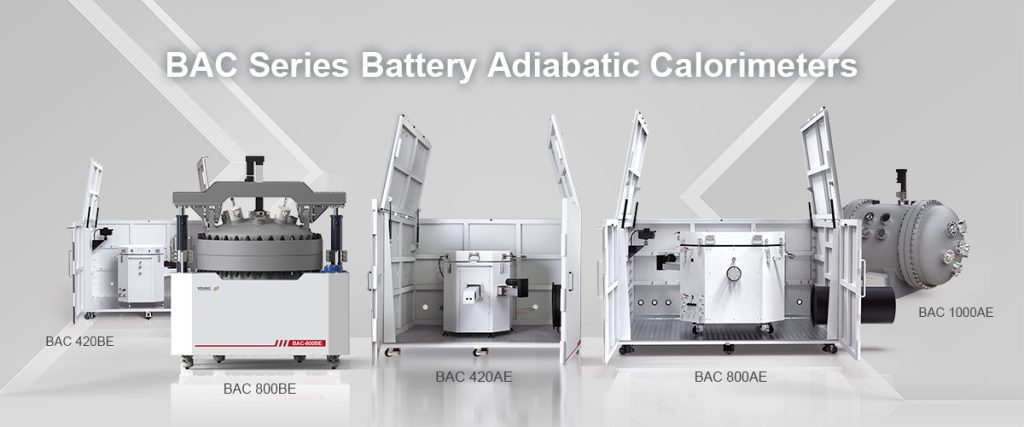
See BAC Series battery adiabatic calorimeter testing capabilities for instrument configurations and test planning.


